The Real Cost of Staying on Tableau — And How the Landscape Has Changed
Apr 13, 2026

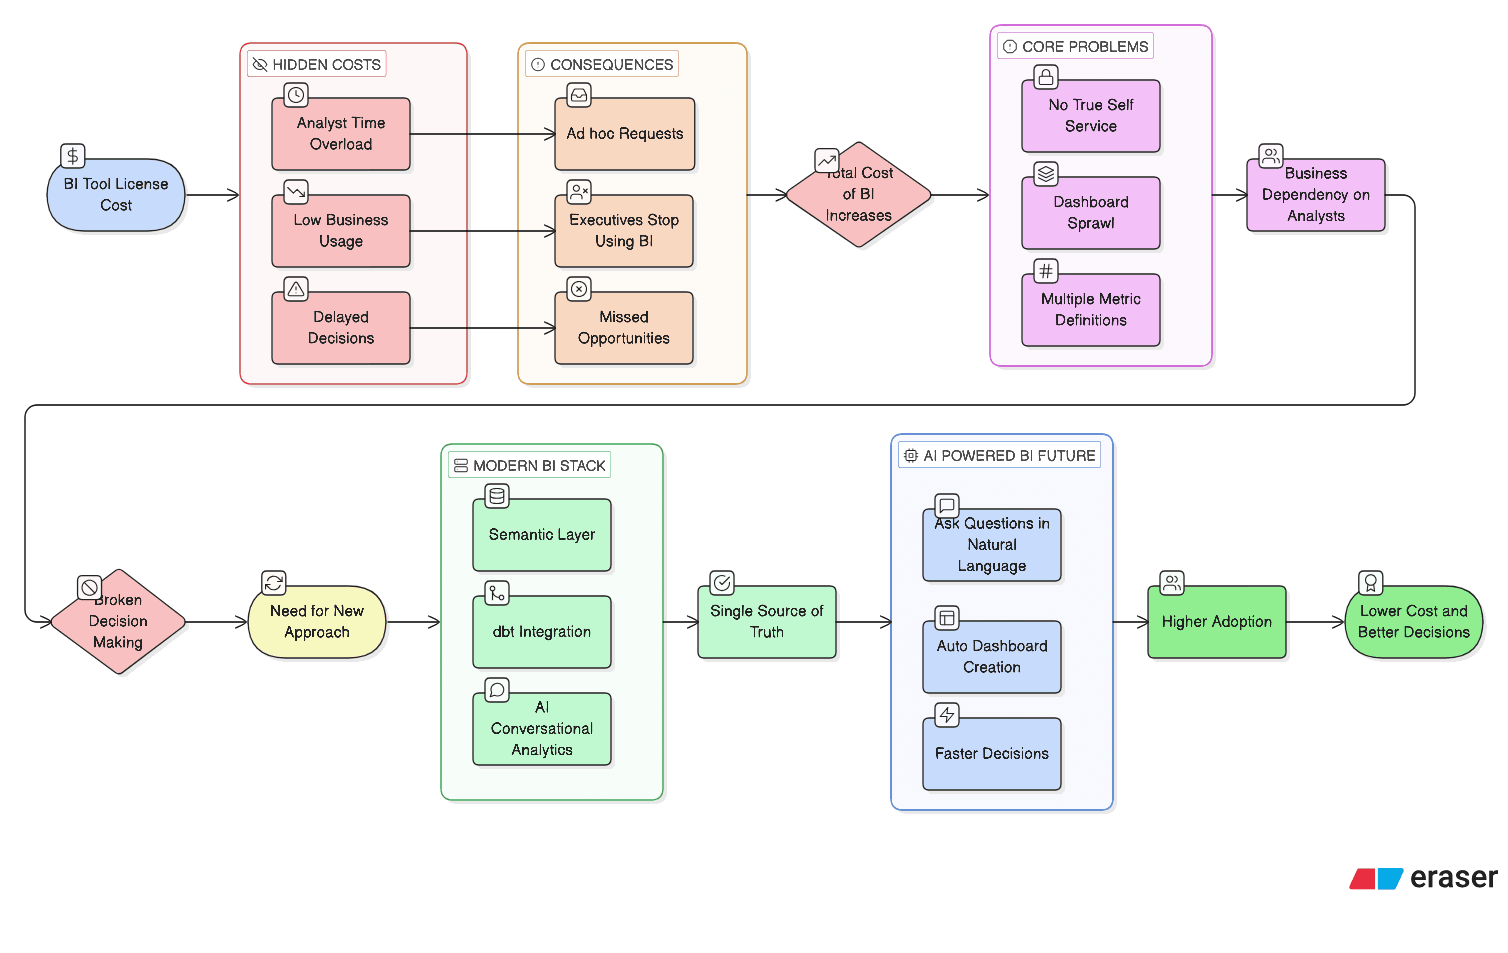
You're not just paying a license fee. You're paying for every decision that waited, every analyst pulled off strategic work, and every insight your business leaders never got. In 2026, with conversational analytics now a shipping reality, that cost has a sharper comparison point than ever.
$500K+ Typical total annual BI cost at a 300-person SaaS company when fully loaded | 11% Of Tableau licenses used in a meaningful, recurring way by business users | 58% Of analyst time spent on reactive, ad hoc requests instead of strategic work |
The Invoice Is the Smallest Part of the Bill
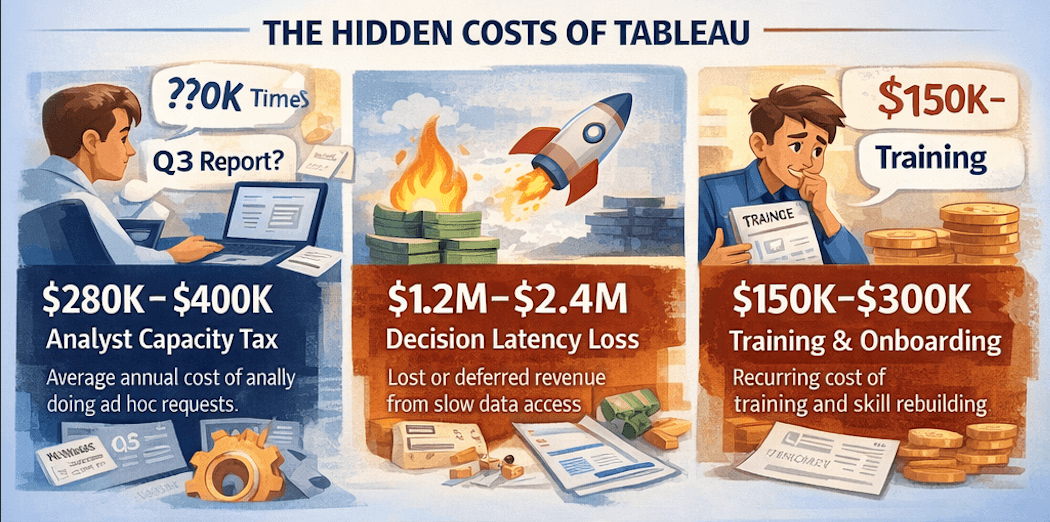
When the CFO asks about your BI spend, you know the number: $75K, $200K, maybe $500K a year in Tableau licenses, depending on your seat count. That's the figure on the invoice. Clean, auditable, and easy to defend in a budget review.
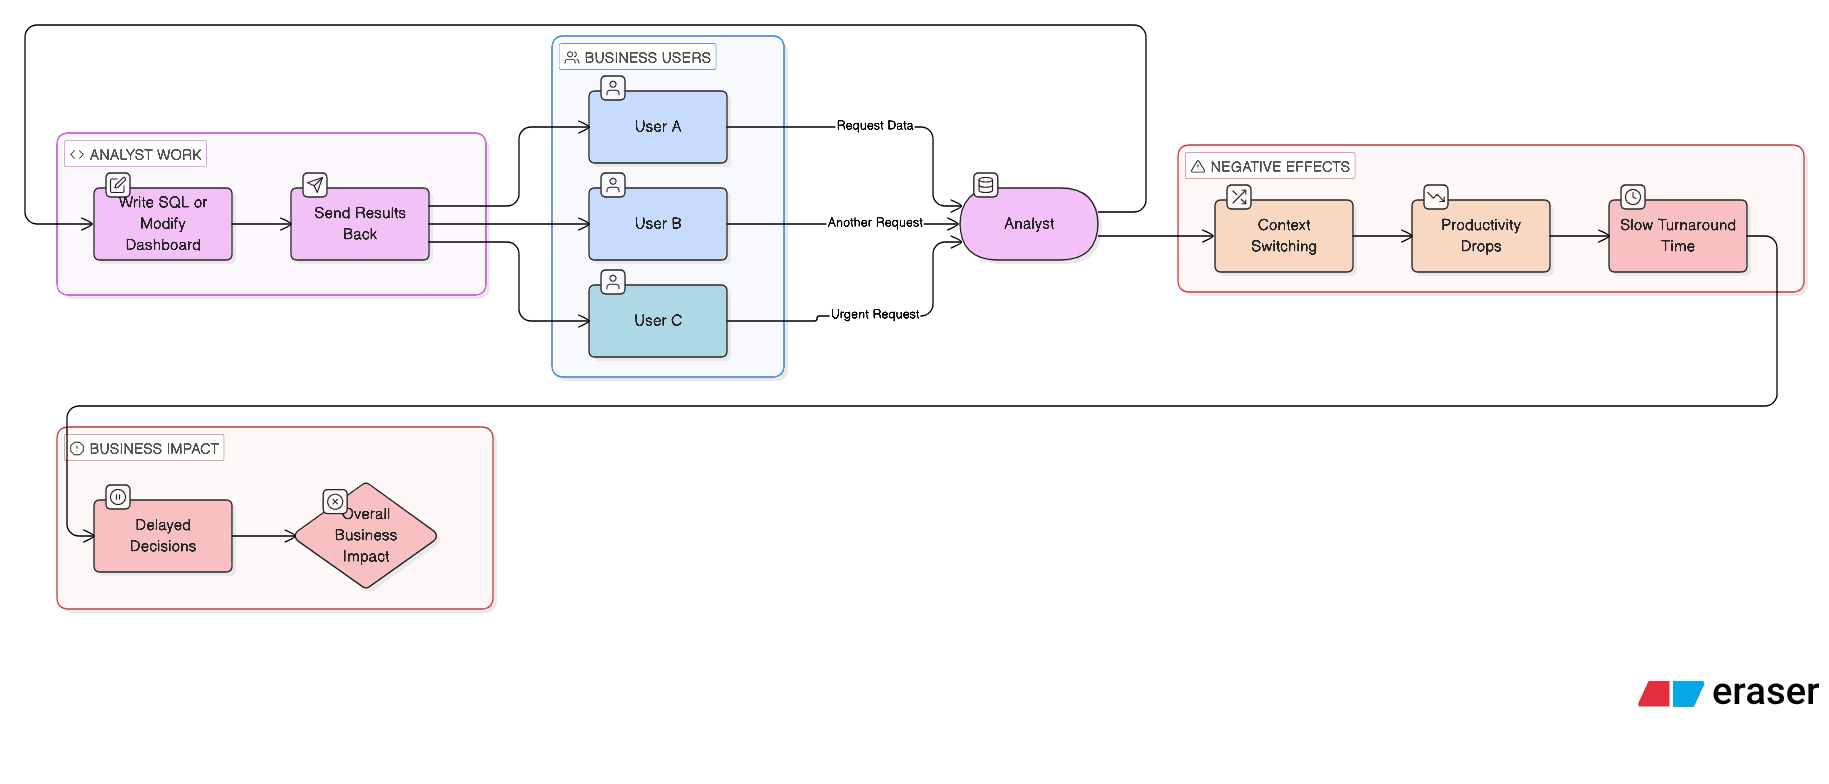
But it's not the real number. The real cost is buried in timesheets, in delayed campaigns, in analysts answering the same question for the twelfth time this quarter, and in executives making calls they weren't equipped to make.
Tableau's Creator license runs $70–$115 per user per month. For a 25-seat team, that's $1.4M–$2.3M over three years before factoring in implementation, training, or Salesforce bundling. The part that quietly compounds is the operational overhead — the human cost of running a BI tool that most of your organization can't independently use.
The hidden analyst tax A mid-size SaaS company with four full-time analysts found that 60% of their team's weekly hours went to fielding ad hoc questions — pulling segments, updating dashboards, and tweaking filters. At a blended fully-loaded cost of $140K per analyst, that's $336K in analyst capacity being used as a query help desk. Per year. On top of the license fee. |
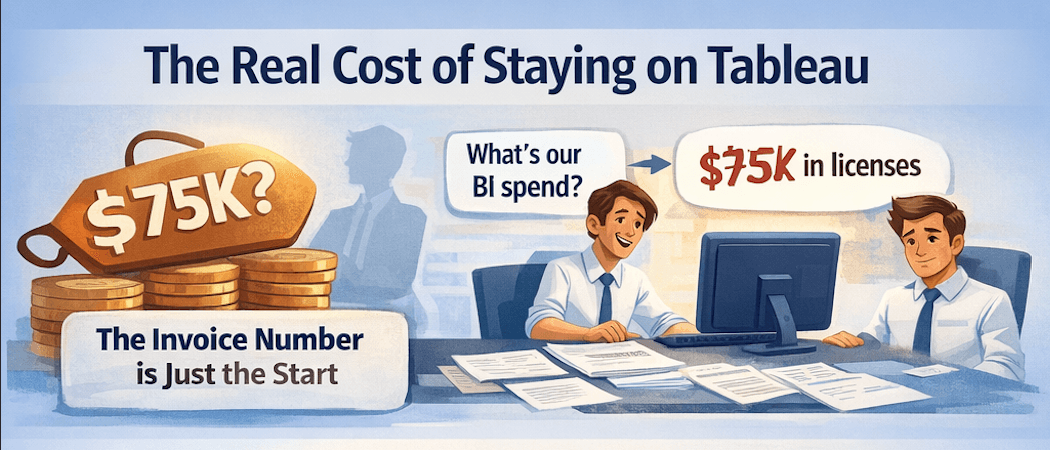
Three Hidden Costs That Don't Appear on Any Invoice
$280K–$400K ANALYST CAPACITY TAX Average annual cost of analyst hours absorbed by reactive BI requests at a 200–500 person SaaS company. | $1.2M–$2.4M DECISION LATENCY LOSS Estimated annual deferred or lost revenue from decisions delayed 3–7 days waiting on data. |
$150K–$300K TRAINING & ONBOARDING DRAG Recurring cost to train new hires, rebuild lapsed skills, and maintain governance on a technical tool. | 8× TRUE COST PER INSIGHT When only 11% of seats are actively used, the effective cost per insight is 8–9× the stated per-license rate. |
Why Self-Service Never Worked the Way the Pitch Said
The pitch was self-service analytics. Business users would explore data on their own, build views, answer their own questions. A compelling vision in 2015. Still appearing in vendor slide decks today.
But self-service analytics requires a level of data literacy that most business users don't have and don't need. Your VP of Sales doesn't need to learn data modeling. They need answers, fast. A tool that requires two hours of training isn't self-service — it's a technical tool with a self-service label.
Self-service BI was always the promise. But you can't call it self-service when the people it was built for gave up and went back to emailing the data team. |
The Governance Trap: When Tableau Does Get Adopted
The companies where Tableau adoption is highest are often the ones with the biggest governance headache. When business users can build their own views, they do — and soon you have 400 dashboards, three different definitions of 'active customer,' and a CFO looking at a churn number that doesn't match what the CRO presented in the board meeting.
Three NRR definitions in one company A Series C SaaS company with strong Tableau adoption discovered during board prep that their Sales, CS, and Finance teams were each calculating NRR differently — all from the same underlying data, all within Tableau. Reconciling the three figures took a week of analyst time and a difficult conversation with the board. The root cause wasn't bad data. It was a tool that made it easy to define metrics independently, and hard to enforce a single source of truth. |
What the Salesforce Acquisition Means for Your Roadmap
Tableau was acquired by Salesforce in 2019 for $15.7 billion. Since the acquisition, Tableau's development trajectory has increasingly pointed toward deep Salesforce integration. If your data lives in Snowflake, BigQuery, or any warehouse that isn't Salesforce-native, you're paying for a product being optimized for a different customer.
Standalone Tableau Server has been de-emphasized in favour of Tableau Cloud. The Salesforce Data Cloud bundle has introduced new licensing complexity that most buyers don't fully understand until renewal. The product's centre of gravity has shifted — and if your stack doesn't align with that shift, the total cost of ownership will keep climbing.
The 2026 BI Landscape: Five Tools, Honest Assessments
The BI market in 2026 looks meaningfully different than it did at Tableau's last major architectural update. Conversational analytics has moved from demo to production. AI-generated dashboards are shipping. Governance architecture has become the real differentiator. Here's how the five most commonly evaluated tools stack up — without the vendor spin.
Power BI: The Budget Choice With a Hidden Escalation Problem
Power BI's sticker price — $14/user/month for Pro — makes it one of the most attractive options on paper. For organisations inside the Microsoft stack, it's a genuinely defensible choice.
But the 'starts at $14' story rarely ends there. Many teams buy a handful of Pro licenses, then discover they need dozens more when trying to share the first dashboard. The jump to Premium capacity ($4,995/month) is often made under pressure, not as a planned investment. By year four, a team that started at $600/year can find itself paying nearly $60,000 — a 100× escalation triggered by a single governance decision.
Power BI's DAX modeling language is powerful but brittle at scale. Metric definitions diverge the same way Tableau allows. And from April 2026, Microsoft has updated its pricing for Power BI licenses, adding further TCO pressure. For teams running on Snowflake or Databricks, the ecosystem lock-in creates friction that compounds annually.
Looker: The Google Ecosystem Play
Looker has genuine strengths: a powerful semantic modelling layer (LookML), an API-first architecture excellent for embedded analytics, and strong BigQuery integration. But at $60,000/year minimum, with dashboard viewers at $400/user annually, the pricing model raises real questions for most organisations.
Like Tableau post-Salesforce, Looker's trajectory post-Google acquisition has drifted toward 'BigQuery companion app.' Organizations running Snowflake find their Looker admins spending a week fighting connector issues that BigQuery customers never hit. Per Gartner analysis, organisations spend 40–60% of their total Looker investment on LookML development and maintenance — a meaningful hidden cost that doesn't appear in the license line.
Metabase: The Open-Source Option and Its Real Limits
Metabase's free, open-source tier is genuinely useful and has earned a real following at startups and small data teams. The visual query builder means non-technical users can explore data without writing SQL.
But Metabase has a fundamental ceiling: it has no semantic layer. No central place to define 'revenue' once and reuse it everywhere. Two analysts will build the same metric on different dashboards and get different numbers. The Enterprise plan — which unlocks features comparable to what Tableau and Power BI offer — runs $15,000/year just for the basics. Metabase is a legitimate starting point for small, technical teams. It isn't a long-term enterprise solution where governance matters.
Omni: The Modern Data Stack Native
Omni is the newest entrant in this comparison and the one most explicitly designed for the architecture forward-looking data teams have already built: Snowflake or BigQuery for the warehouse, dbt for transformation, and a semantic layer as the source of truth.
Where Tableau and Looker have semantic layers as an afterthought, Omni's is the foundation. The bi-directional dbt integration is a standout feature: teams can prototype new metrics in Omni's UI and push them directly back to a dbt repo when ready — closing the loop between exploration and production-grade modelling. The tradeoff is maturity: Omni is earlier-stage than Tableau or Power BI, and pricing requires a sales conversation.
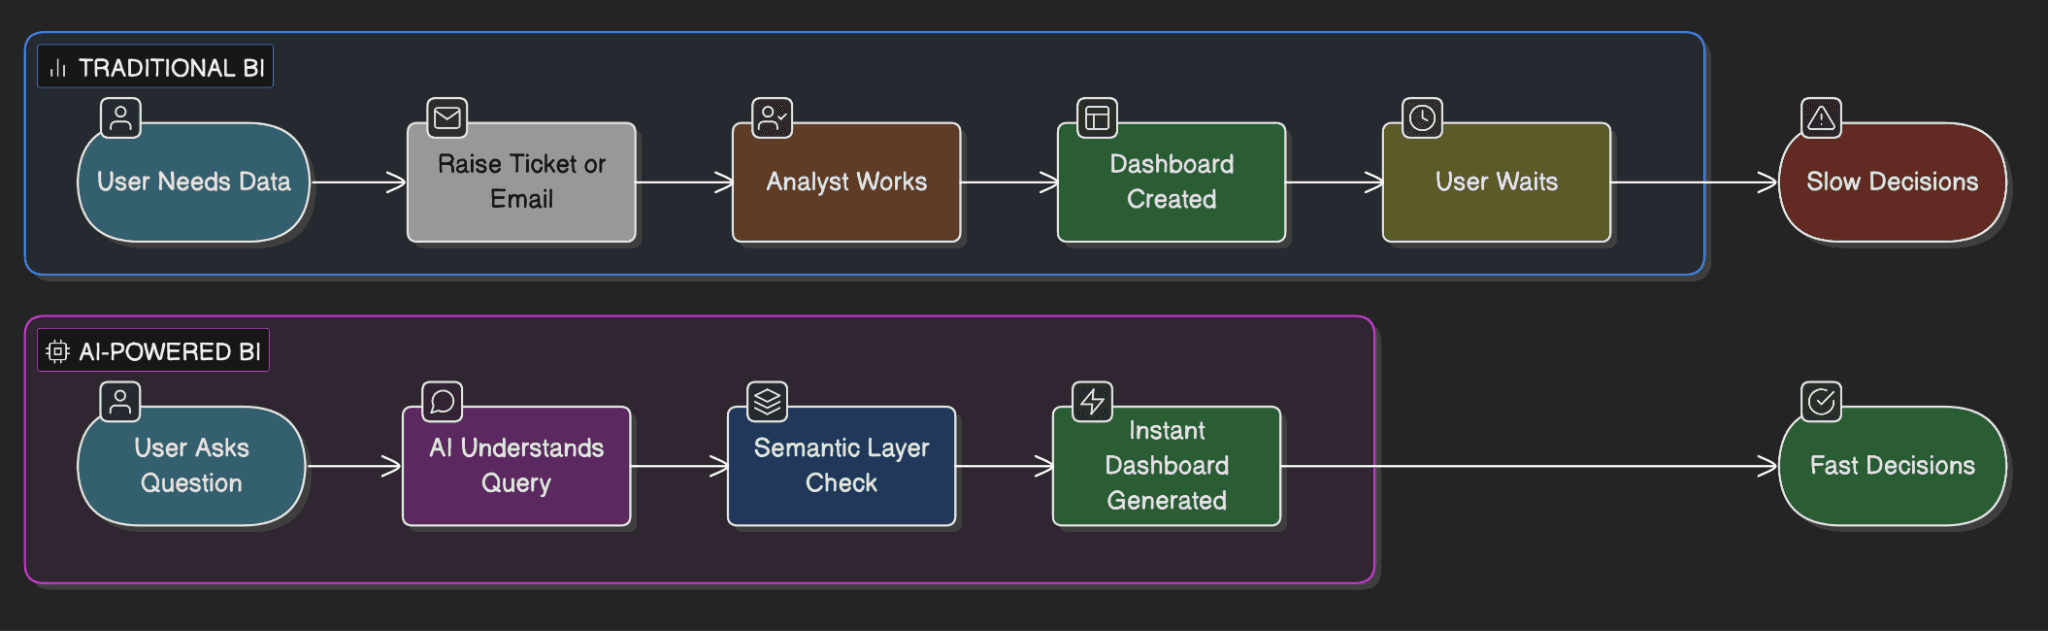
Conversational Analytics in 2026: From Demo to Production
Natural language querying was a compelling pitch in 2020. In 2026, it's a shipped capability — but the quality of implementation varies enormously. The tools that get this right are grounding natural language queries in a governed semantic layer. The tools that get it wrong are routing queries through an LLM pointed at a raw warehouse, producing answers that are confident and occasionally wrong in ways that are hard to detect.
|
|
|
|
|
Agent Blobby: What AI-Native Dashboard Creation Actually Looks Like
Most AI features in BI tools let you ask questions about existing dashboards. Blobby does something different: you can now create a dashboard from scratch with just a prompt. The team is also building tools to sit alongside existing dashboards for refinement post-creation — editing, updating, arranging, deletion — anything you can do in the UI is being lifted into the AI experience.
From prompt to production dashboard — governed, not guessed
"Our big lesson with AI is that it's about control. When you constrain it and give it context — like Omni's semantic layer does — you get predictable, reliable results that drive action." The key differentiator is not the speed of dashboard creation. It's that Blobby operates within the same semantic layer that governs every other metric in the system. |
Blobby has also recently gained the ability to act, not just analyse. A direct connection to Salesforce MCP means live data — and once you have the live connection, you can start updating records directly from Omni. Analytics that leads directly into action in source systems is a genuinely new capability that most traditional BI tools haven't yet approached.
Side-by-Side: The Honest Pricing and Capability Comparison
The table below reflects publicly available pricing and capability data as of Q1 2026. Where pricing is contract-based or negotiated (Omni, Looker), this is noted.
Dimension | Tableau | Omni | Power BI | Looker | Metabase |
|---|---|---|---|---|---|
License Cost | $70–115/user/mo | Contract; not public | $14/user/mo (Pro) | $60K+/yr min | Free (OSS) |
Self-Service (non-tech) | Low — needs training | High — AI chat + UI | Moderate | Low — LookML barrier | Medium — SQL teams |
Governed Semantic Layer | Weak — metric sprawl | Core architecture | DAX-based, brittle | LookML — complex | None |
AI / Conversational | Einstein (SF-locked) | Blobby — governed | Copilot (MS-locked) | Gemini (BQ-locked) | Basic, no grounding |
AI Dashboard Generation | Not available | Yes — prompt to dash | Not available | Not available | Not available |
dbt Integration | Limited | Bi-directional | Limited | Read-only | None native |
Warehouse Flexibility | Good; drifting Salesforce | Excellent multi-cloud | Good; drifting Azure | Good; drifting BigQuery | Good (small data) |
Governance at Scale | Dashboard sprawl | Layered model | DAX diverges | Good if LookML kept | Breaks at 100+ users |
Hidden Cost Risk | High | Medium (newer) | High — Premium jump | High — LookML labor | Medium — Ent. tier |
Best Fit | Deep Salesforce shops | Modern stack + AI | Microsoft-native orgs | All-in Google Cloud | Small tech teams |
Who Should Stay — And Who Should Be Looking
No tool is right for every organisation. The honest answer depends on your stack, your team structure, and your roadmap.
|
|
What Good BI Looks Like in 2026 → Business users get answers in seconds without opening a ticket or filing a request — conversational AI is the interface → A single governed semantic layer means NRR is NRR everywhere — not three different numbers for three teams → AI builds dashboards from prompts grounded in the same metric definitions the CFO trusts → Analyst time shifts from reactive requests to proactive, high-leverage strategic work → BI adoption climbs from 11% to 60%+ because the interface fits how executives actually think → Forecasting and advanced analytics available directly in the BI layer — no separate data science handoff → License spend drops 30–50% as bloated seat counts get right-sized to actual usage |
The Question to Answer Before Your Next Renewal
Tableau renewals have a way of auto-piloting through procurement. The invoice arrives, someone approves it, and another year begins. The same is true for Power BI, for Looker, for any BI tool that has become infrastructure without ever being evaluated as a strategic decision.
Before that happens this cycle, ask two questions. First: what is the fully-loaded cost of our current BI setup, and what decisions aren't being made — or are being made badly — because of how it works? Second: does our current tool have a credible AI roadmap that works with our stack — not just within a single vendor's ecosystem?
The gap between tools that have shipped governed conversational analytics and dashboard generation, and tools that are still promising it, is widening fast. That gap has a cost too — it's just harder to put on an invoice.
The goal of this analysis is not to declare a winner. Each tool has a real use case where it's the right call. The goal is to stop letting a renewal date make the strategic decision for you, and to ensure that whatever you're paying, you understand what you're actually getting — and what you're leaving on the table.
The clearest signal you need to evaluate alternatives If your analysts are spending more than 40% of their time on reactive requests, your business users have stopped logging into your BI tool, and your data lives in a modern warehouse not owned by the same company that owns your BI vendor — you are the target customer for the current generation of AI-native BI platforms. Run the fully-loaded cost math before your next renewal. The number is rarely what the invoice says it is. |